Search
“商品结构” — 8 results

Comparative Analysis of Export Commodity Structures of Major Economies in 2023
Based on HS code classification, this analysis compares the export commodity structures of five major economies (China, USA, Germany, Japan, South Korea) in 2023, highlighting differences in machinery, chemicals, transport equipment, and other sectors.

China's Major Export Commodity Structure Outlook 2024-2025: Steady Growth in Machinery & Electronics, Rise of New Energy
Over the next two years, China's exports of machinery & electronics will maintain steady growth, textiles & apparel will continue to decline, while new energy products (including EVs and solar) will expand rapidly, accelerating the shift toward higher value-added goods.
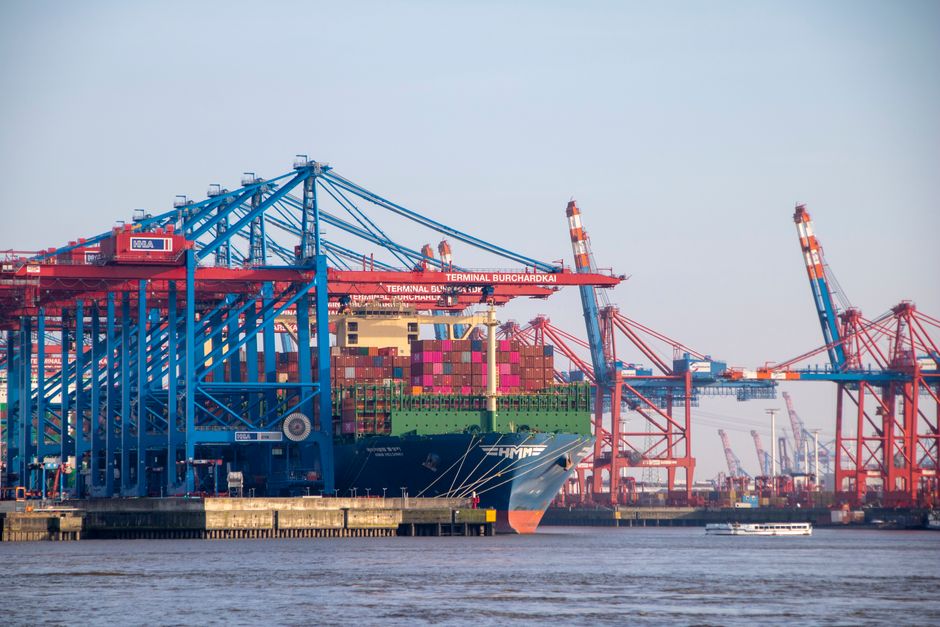
In-depth Analysis of China's Export Commodity Structure in 2024: Shift from Labor-intensive to Technology-intensive
Based on 2024 customs data, this report analyzes the transformation of China's export structure from traditional labor-intensive products to high-value-added technology-intensive ones, covering current status, drivers, challenges, and recommendations.
Annual Comparison of China's Export Value by Major Commodity Categories (2018-2022)
China's Export Commodity Structure Overview (2023 Est.): Mechanical & Electrical Products Dominate
China's Export Product Structure: Electromechanical Products Account for Nearly Half in 2023
Estimated Share of Chinese Exports to EU by Product Category (2023)

Comparison of China's Export Composition to Major Markets in 2023 (USD Billion)
A stacked comparison of China's export categories to five major markets (US, EU, ASEAN, Japan, South Korea) based on estimated 2023 data.