Comparison of First Mile Cost Structure Across Major Markets (2024)
Infographic showing the differences in cost proportions of transport, customs clearance, warehousing, insurance, etc., in first mile logistics across China, Southeast Asia, Europe, and the US.
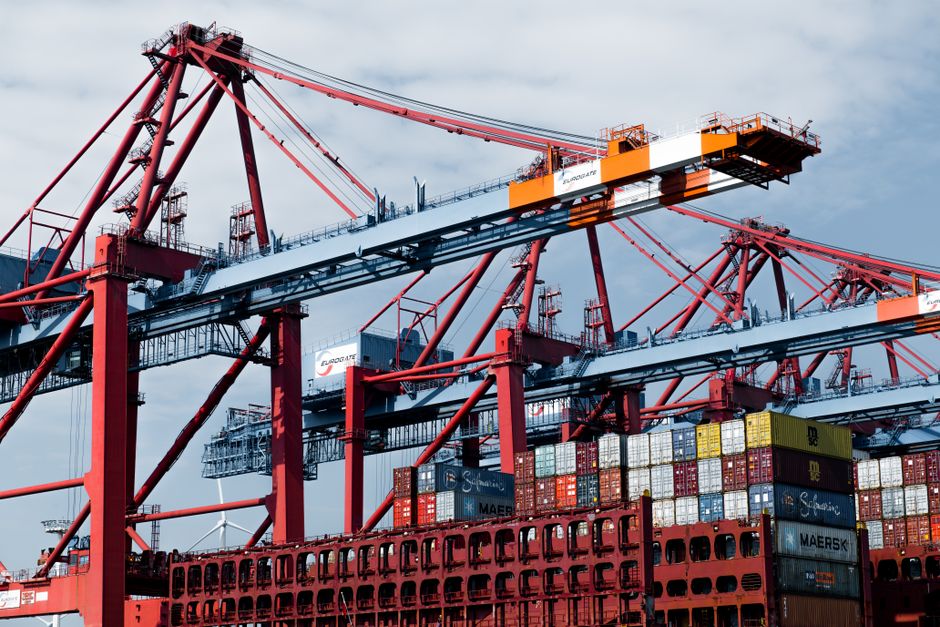
First Mile Cost Components
First mile logistics costs typically include the following major parts:
- Transportation Fees: Inland transport from factory or warehouse to export port/airport, plus international sea/air/land freight.
- Customs Clearance Fees: Export and import customs declaration, inspection, documentation, etc.
- Warehousing Fees: Temporary storage, sorting, container loading at origin warehouse.
- Insurance Fees: Cargo transport insurance covering loss or damage.
- Others: Packaging, labeling, inspection, contingency fees, etc.
Cost Structure Comparison Across Markets
The stacked chart below illustrates the cost composition for four scenarios (based on 2024 industry estimates):
- China Export: Transport accounts for the highest share (~55%), followed by customs clearance (15%) and warehousing (12%), with insurance lower (5%).
- Southeast Asia Local: Transport ~45%, customs clearance higher (20%), warehousing (18%), insurance (7%).
- Europe Import: Transport 50%, customs 12%, warehousing 20%, insurance 8%, others 10%.
- US Import: Transport 48%, customs 10%, warehousing 22%, insurance 10%, others 10%.
Key Insights
- China export has the highest transport share due to long-haul international shipping.
- Southeast Asia shows distinctly higher customs clearance costs, reflecting local clearance efficiency and hidden fees.
- European and US markets have higher warehousing and insurance shares, indicating mature market emphasis on compliance and risk coverage.
- Enterprises should adjust first-mile strategies per target market: e.g., budget more for customs in SEA, and consider warehousing costs in Europe/US.
Related content
2025 Multi-Market Customs Clearance Efficiency Comparison: China, USA, EU, Vietnam
This infographic compares the time distribution of customs clearance processes in China, the USA, the EU, and Vietnam, highlighting differences in document preparation, electronic declaration, inspection, and release.

Global Customs Clearance Efficiency Outlook 2025-2026: Automation and Compliance Challenges
Over the next two years, global customs clearance will accelerate digital transformation, with average clearance times expected to decrease by 15-20%, but rising trade compliance requirements and geopolitical factors add uncertainty.
2024 Global Top 10 Countries in Customs Efficiency

In-depth Analysis of China Enterprises' Cross-border Customs Clearance Status and Optimization Strategies in 2024
Based on public data and industry estimates, this report analyzes the key pain points and drivers of customs clearance for Chinese enterprises going global, and offers systematic optimization recommendations.